
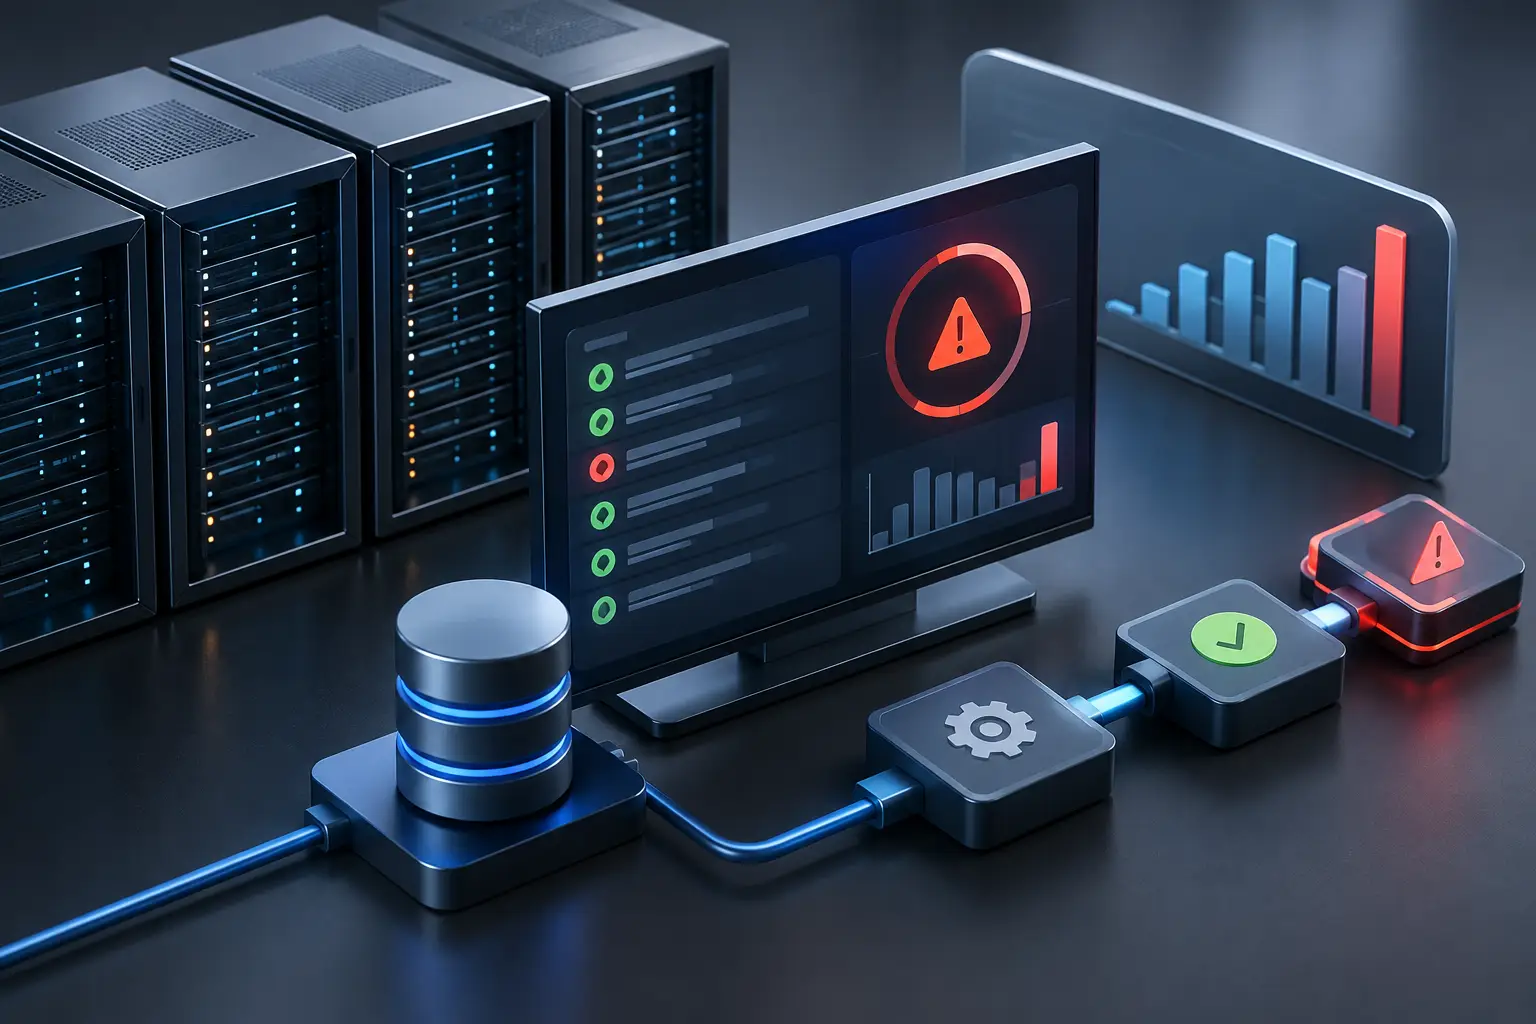
A batch job can fail at 2:00 a.m. and remain invisible until receiving cannot print labels, finance cannot complete a close task, or planners see stale supply data. To monitor JDE batch failures well, we need to watch the job lifecycle, its output, and the business process that depends on it. A red job status alone rarely gives the operations team enough context to act.
JD Edwards EnterpriseOne batch processing relies heavily on UBEs, or Universal Batch Engines. These reports and background programs create invoices, update inventory, post transactions, generate documents, and run many scheduled activities. A failure can result from a technical condition, incorrect processing options, missing data, a locked record, or an unavailable dependency. The monitoring design must make those different causes visible early.
Monitor JDE Batch Failures at Three Levels
The first level is job execution. We check whether a submitted UBE started, completed, ended in error, or remains in a waiting state longer than expected. Job queues require equal attention. A job that never reaches execution can cause the same business disruption as a program error.
The second level is output. A job may report completion while producing an empty PDF, an incomplete electronic file, or a report with error messages. For an invoice print run, a successful status has limited value if the output is missing or the report shows that no records qualified. We therefore define what useful output looks like for each critical process.
The third level is process completion. This is where monitoring becomes meaningful for Finance, Procurement, Manufacturing, and Distribution. Did sales order processing create the expected pick requests? Did the post program update the general ledger? Did the MRP run finish before planners begin their workday? These checks connect JDE technical events to operational consequences.
Separate failed, delayed, and incomplete work
A monitoring rule should distinguish a hard failure from a late or incomplete run. A hard failure usually has an error status and often creates a diagnostic message in the job log. A delayed job may sit in a queue because a server is unavailable, a queue is paused, or higher-priority work is consuming capacity. An incomplete run can finish normally yet leave transactions unprocessed because a selection rule, version, or data condition excluded them.
Each condition needs a different response. A CNC specialist may investigate a stuck kernel or queue. A functional owner may need to review data selection or processing options. An application developer may need to trace a custom report. One generic “batch failed” alert sends people looking in the wrong place.
We also avoid treating every scheduled job as equally urgent. A monthly archive report can wait. A sales order document job during a shipping window cannot. Priority should reflect the next business activity, the available manual workaround, and the time required to recover.
Build a Monitoring Model Around Business Windows
The most useful starting point is a short register of critical batch chains. A batch chain is the sequence of jobs and dependencies required for a business outcome. For example, an overnight manufacturing cycle may include inventory updates, planning calculations, work order processing, and reports for planners. Monitoring each job independently can hide a broken sequence.
For every critical chain, document the expected schedule, normal duration, queue, server, responsible team, and business deadline. Add the version name, because JDE versions often differ in data selection, processing options, and destination settings. This makes an alert actionable without requiring a long investigation before the first decision.
A practical monitoring rule needs four elements:
- an expected start or completion time;
- an allowed duration or delay threshold;
- a clear definition of valid output or downstream result; and
- a named first responder with an escalation path.
Thresholds should reflect the process. A job that normally runs for 20 minutes may deserve investigation after 45 minutes. A job with a normal range between 20 minutes and three hours requires a wider threshold and more context. Static time limits are useful, though they need review after major volume growth, ESU changes, infrastructure work, or schedule changes.
In one manufacturing environment, a planning run was marked as successful every night. Planners still received incomplete recommendations several mornings each month. The cause was a preceding inventory update that completed after the planning job had already started. The job monitor showed green status for both jobs. We added a dependency check based on the actual completion sequence and a control for the expected planning output. The issue then appeared before planners opened their workbench.
Watch the signals that explain the failure
Job status is the first signal, not the only one. We correlate it with queue state, server availability, JDE logs, database messages, and output location. If a UBE ends in error, the report output and job log often identify whether the immediate cause is data-related, permission-related, or technical.
Work Center messages can also provide useful operational evidence. The JDE Work Center is the internal messaging area where applications and batch jobs can report exceptions to users or roles. It works well for business-facing alerts, provided that message ownership is maintained. A message sent to an inactive user is little better than no alert.
The monitoring design should include custom UBEs and integrations. These are frequent blind spots. A custom report may return a completion status while an external file transfer fails afterward. Orchestrations can also depend on batch results, file locations, and service availability. We check the complete handoff, not only the JDE step.
Route Alerts to People Who Can Act
Alert volume quickly destroys trust. If every retry, minor warning, and low-priority report creates an urgent notification, teams stop reading notifications. We set severity according to business impact and route it to the role that can perform the first useful action.
A technical alert can go to the JDE operations team when a queue stops, a service is unavailable, or repeated jobs fail across modules. A finance posting exception should reach the process owner and the JDE support contact. The escalation path should name a person or a small group. “IT” is not an owner.
Timing matters as much as routing. Overnight processing often needs an early warning before business teams arrive. A notification at the start of a missed processing window gives the support team time to assess the problem, restart a safe job, or prepare users for a workaround. A morning dashboard that only shows yesterday’s errors is useful for analysis, not prevention.
We recommend that restart procedures are written for each high-impact job. A restart may be safe when the program is designed to reprocess eligible records. It can create duplicate documents or inconsistent updates when the job stopped after partial processing. The procedure should state what to check before rerunning: job logs, transaction status, output records, and any downstream interfaces.
Make the Status Visible Without Manual Reporting
Many JDE teams still rely on someone opening Submitted Jobs, reviewing several queues, and sending an email each morning. That approach depends on individual availability and misses events between checks. A dashboard can present critical job chains, late jobs, failed jobs, and open exceptions in one view.
The dashboard should show the business name of the process alongside technical identifiers. “Nightly inventory update” is easier to prioritize than a version name alone. Technical details still need to be available for the person diagnosing the issue, including the server, queue, status, run time, and report output.
This operational view can be shown alongside JDE business data without changing the running JDE application. The useful design varies by role. A CIO may need a view of recurring failures and operational risk. A warehouse manager needs to know whether document processing is ready for the next shift. A CNC specialist needs direct evidence for diagnosis.
One distribution organization had a small JDE team and several scheduled document jobs across different queues. A queue pause after maintenance left print work waiting, with no program error to investigate. We configured a threshold for jobs that stayed in a waiting state beyond the normal window, then routed the alert to the operational owner. This reduced the time between the queue condition and human review because the team no longer had to wait for users to report missing documents.
Review Repeated Failures as Operational Debt
A recovered job still deserves review when the same pattern returns. Repeated failures usually point to a condition that is being handled manually: unreliable file availability, an inconsistent version, insufficient cleanup, a record-lock pattern, or a schedule that no longer fits the workload.
We review failure history by process, time, queue, and error type. This separates isolated incidents from recurring operational debt. It also creates a sensible improvement backlog. Some fixes are configuration changes. Others require application development, database review, infrastructure adjustments, or a clearer handoff between business teams.
Start with the three batch chains that would cause the most disruption tomorrow morning. Give each one a business deadline, an owner, a valid-output check, and a documented first response. Once those controls work, expand them to the next processes. That is how JDE batch monitoring becomes a dependable operating practice rather than another screen someone checks when work has already stopped.